

How big is home-court advantage, really?
A look at the size of the home-court advantage in real tennis

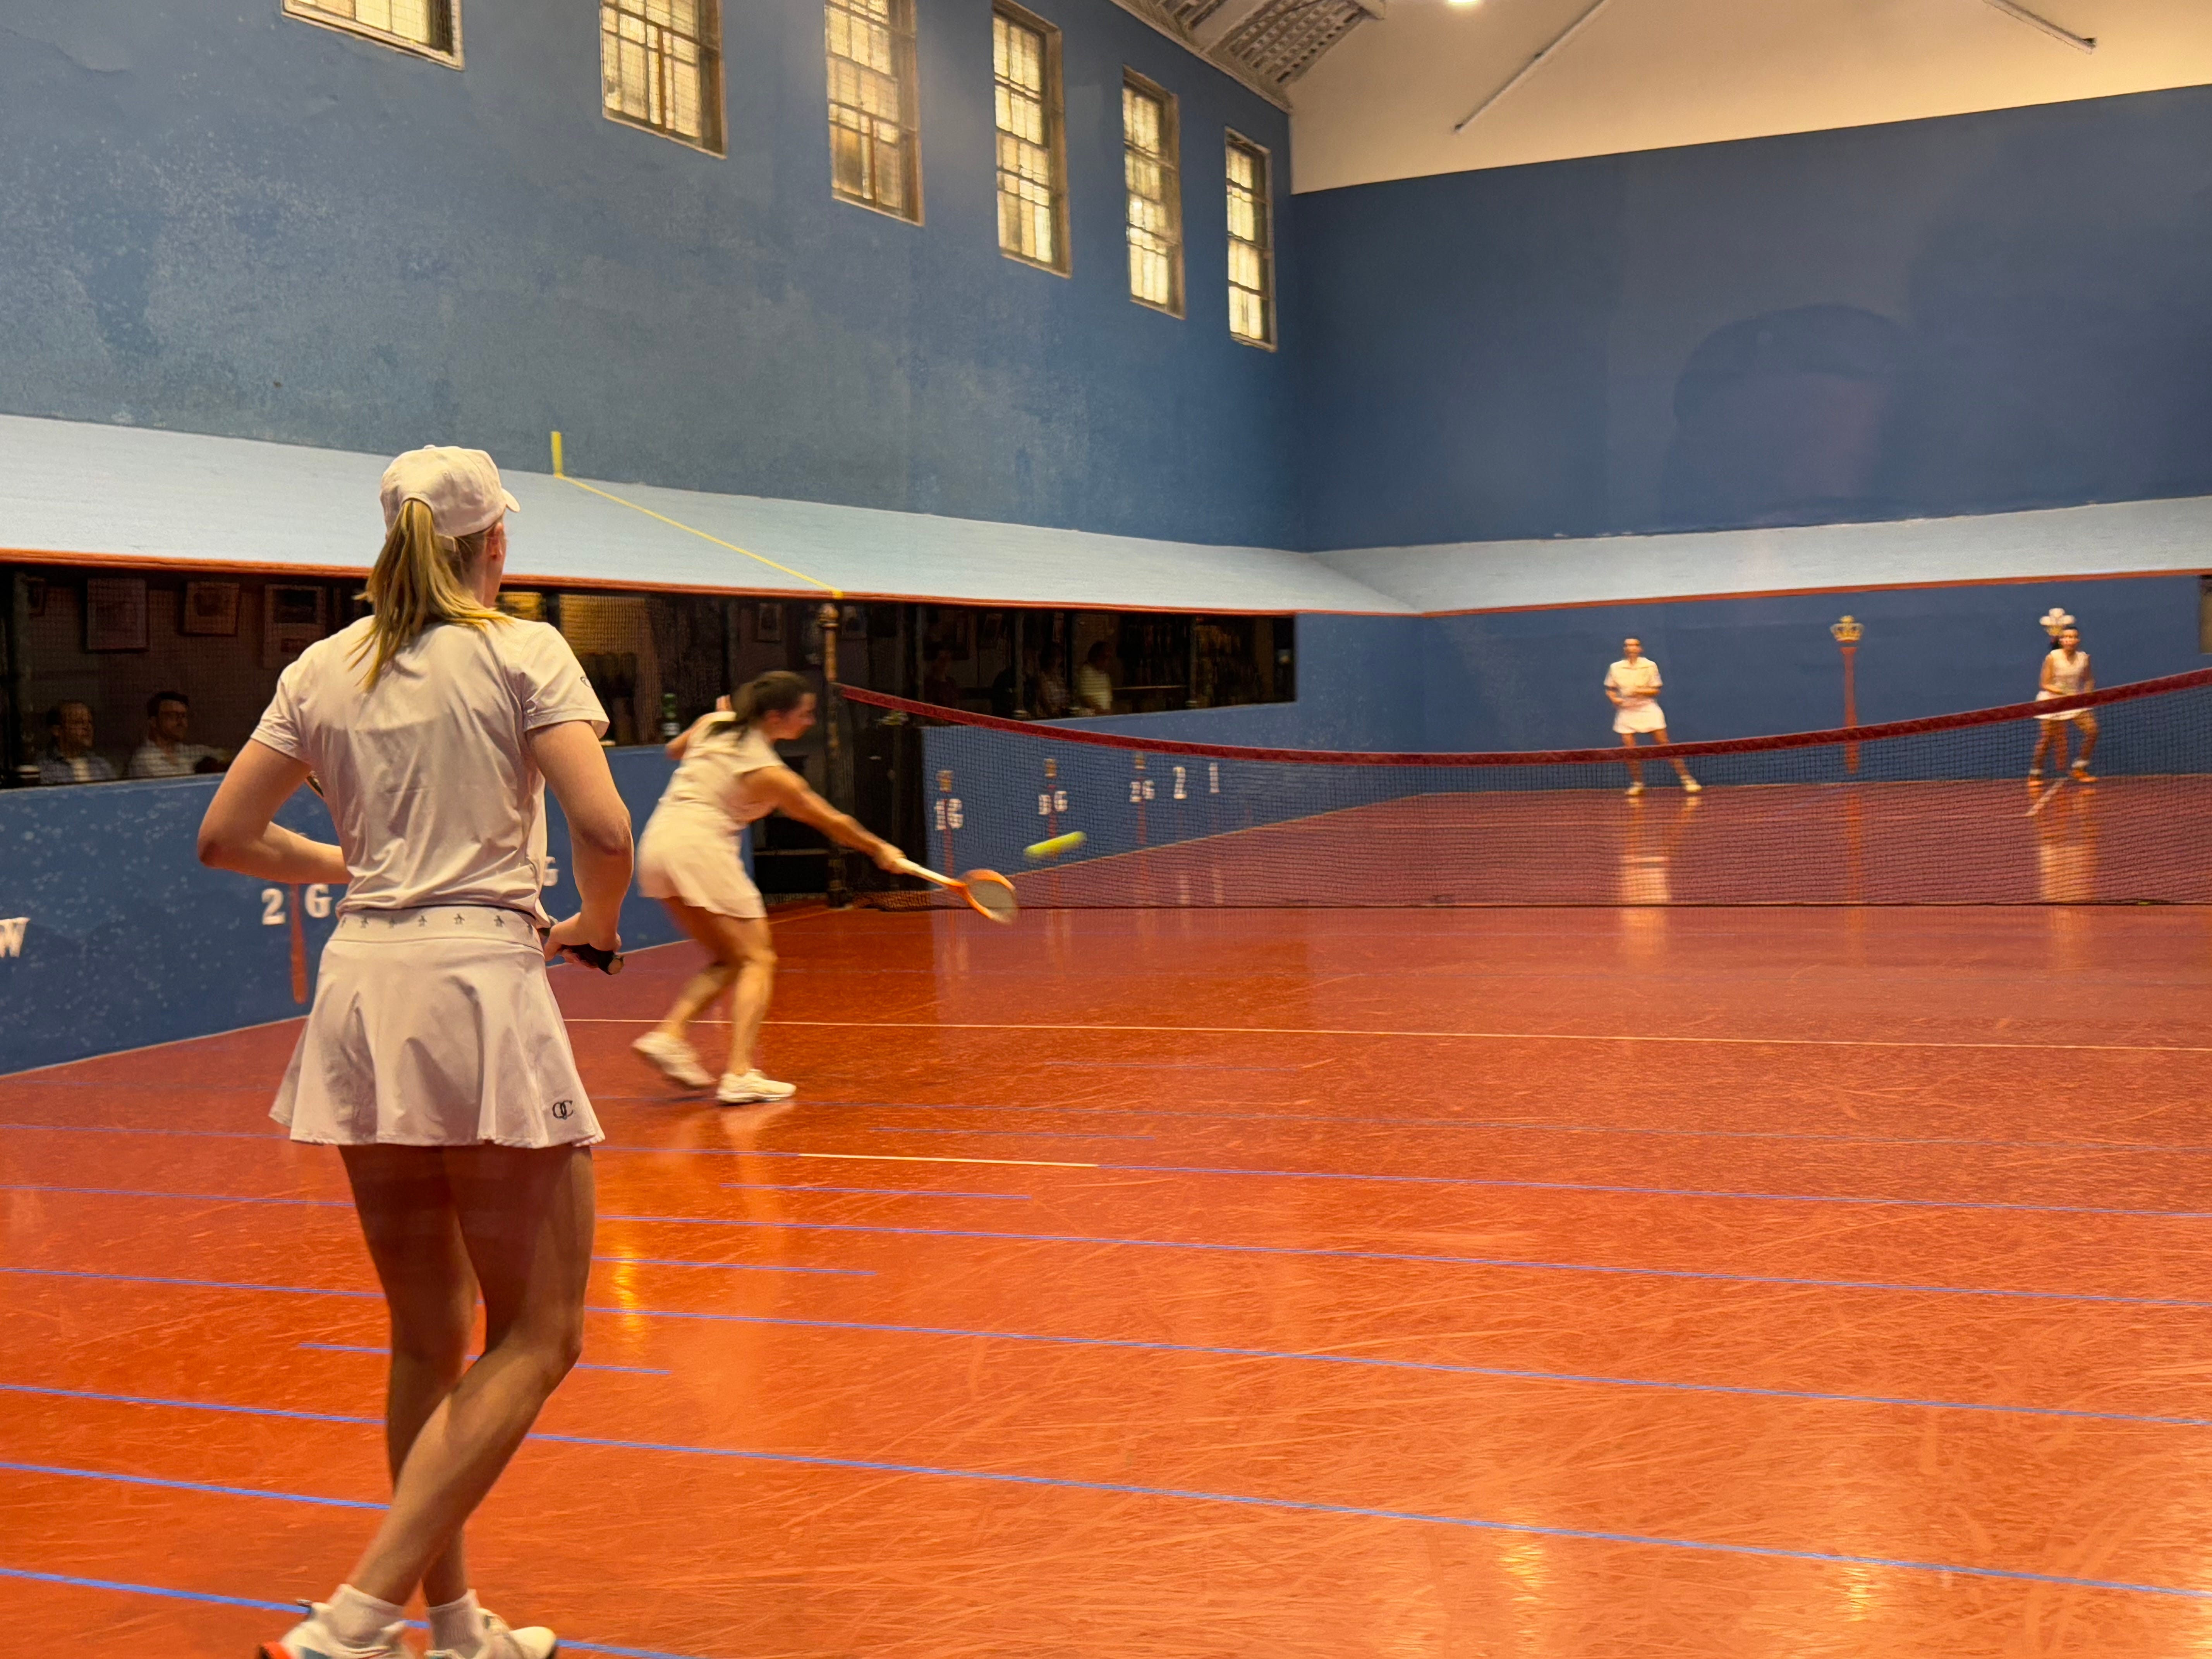
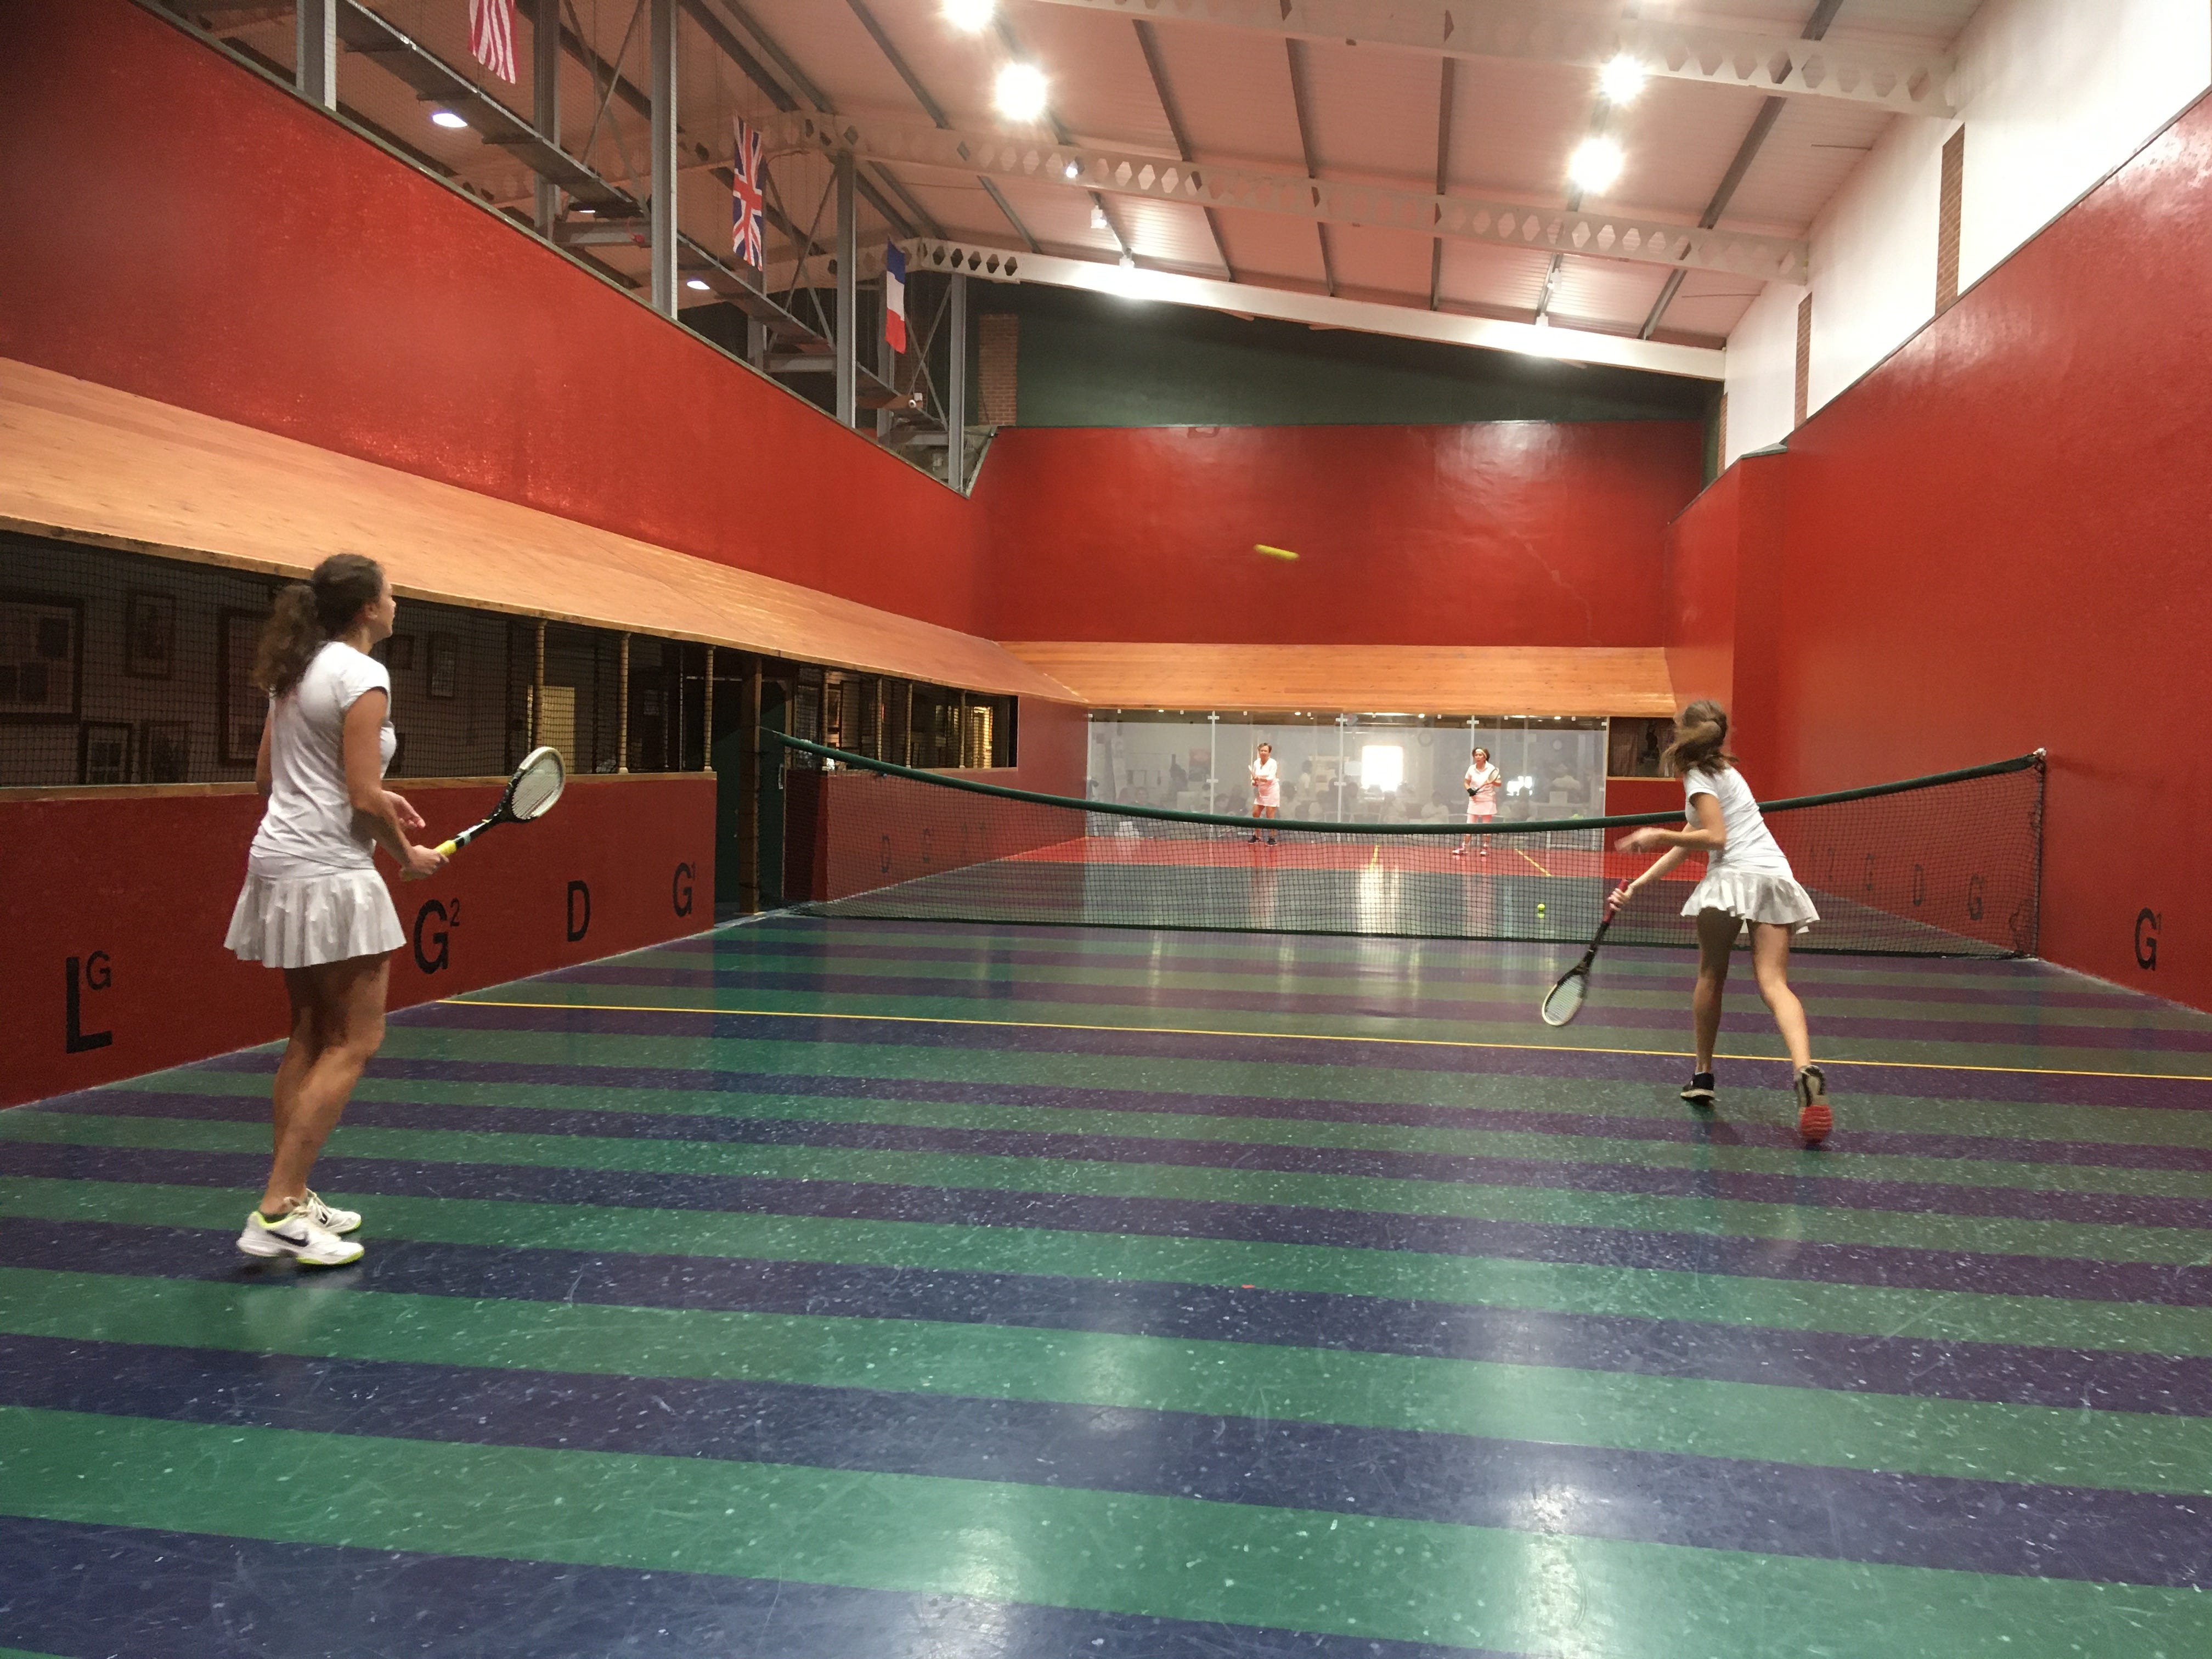
It is one of the defining characteristics of real tennis that no two courts are the same. There are no standard dimensions, materials, colour schemes or court markings. Indeed, even the rules of real tennis vary from country to country and from court to court, with the only universal constant being that the net is three feet high in the center and five feet at the wall. Given that travelling to and “bagging” other courts is a common pastime of recreational real tennis players, how difficult is it really to play on an unfamiliar court, and how much variation is there court to court?
By the current handicapping rules, a player who is playing at a court associated with their primary club on RealTennisOnline (RTO), or who has played on a court more than five times in a 23-month period, is considered to have “familiar court advantage”, which applies a two-point deduction to their handicap whenever they play there. For doubles play, no familiar-court advantage is applied.
The two-points rule is often used in friendly handicap competitions for touring teams playing friendlies against a home team, with the extra points baked into the calculated handicap differences. This has been applied to structured tournaments as well, with the Brodie Cup in the UK awarding a two-point handicap advantage to any visiting team. However, in that case the home side also has an additional selection bias, as it is easier to recruit home players than away players.
So what are the characteristics that make a court a paradise or a slaugherhouse for visiting teams and players? To investigate, we look back at the past 24-years of RTO data of matches played at all courts. To begin, we only consider singles matches, where one player is marked as playing on a familiar court, and where the handicap difference played is the true handicap difference — such that, in at least the majority of cases on a neutral court, the two players should otherwise have a 50-50 chance of winning. The figure below shows the percentage of games won by the home court player on each court that has been in active use plus a 95% confidence band.
A couple of caveats here: two big factors we haven’t taken into account is any bias in a home club’s handicaps. That is, if the home club’s players are systematically under- or over-valued relative to the remainder of the population, and the type and quality of balls used on the court, which can have a significant impact on how a court plays. By taking 24 full years of data, ideally these two factors should average out over time, but that is not guaranteed.
The courts that have only been in operation for a limited part of the dataset, or that are geographically isolated, have much wider error bars than the rest of the court. Examples of the first category are the likes of the rebuilt Washington, Sydney and Bordeaux courts, which have only been played on for the last five years. The American courts tend to experience less non-familiar court play, partially due to the tyranny of distance and partially because a lot of the travelling is done to play matches which don’t fall into the criteria used in this dataset. Sand Valley and Georgian Court (Lakewood) do not have measurements, as they do not have enough players who play at those courts.
At the top of the list of most difficult away courts is a series of courts with some very extreme dimensions. After Falkland Palace, a jeu quarré court, and Harbour Club, which no longer exists, the most extreme is Hobart. As per the court comparison compiled by RT42 and published by CortStats1, Hobart has a brutal combination of the world’s smallest grille, the world’s second most severe — and second most widest— tambour, the world’s fourth flattest penthouse and fourth smallest dedans. When it hosted the most recent Australian Open, it was also noticable how square the ball was playing off the main wall. It also benefits from a population of players who have honed their game with its idiosyncracies, not tainted by playing elsewhere. Perhaps the only court that can match it is Romsey, though there have not been many Romsey members for the better part of two decades and so data is limited.
A close second place goes to the Prested Glass court, which has its own set of extremes. In addition to the glass grille wall — which deadens any serve that reaches it — it has the second longest floor of any court in the world, as well as the steepest penthouse and fifth smallest dedans. Though its striped floor is oft-remarked by visiting amateurs as to why the court is tricky to play, it is more likely that the glass wall is the larger component, as it alters the serving strategies significantly. Indeed, its sister court Prested 2 is one of the most neutral courts in the world by this analysis, probably because it has relatively little use compared to the Glass court; even the Prested membership are having to treat the court as an away court.
Also near the top of the list are both Washington courts. The original Prince’s court — now demolished — had a glass main wall that behaved very differently to any other wall in the game alongside a very square tambour. Meanwhile, the new court, albeit with limited data, has a severe tambour and narrow slits for the dedans and galleries. The other extreme-dimensioned court, Oxford, misses out of the top 5 as there is a decent cross-pollenation of the membership with nearby Radley, meaning that not all members at Oxford have a games finely attuned to the court as, say, a Hobart member.
At the other end of the scale, disregarding the courts with limited data like Sydney, Bordeaux and Aiken, the most neutral courts tend to be those built by Joseph Bickley. This was the closest the game has ever been to having a standardisation in court construction. Most of these courts have between a 53-54% bias, and include the likes of Newmarket, Moreton Morrell and Philadelphia. The only exception is Seacourt, which is arguably the most severe of all the Bickley courts.
But what does a bias of 53% or 58% look like in practice? If one assumes that all games in a tennis match are independent — which is not necessarily true — an ordinary home-court advantage of around 53% chance of winning a game translates into 58% likelhood of winning a 6-game set, and a 62% likelihood of winning a best-of-3 set match — around a 5 in 8 chance. Meanwhile a 58% game won ratio — the advantage of Hobart or Prested Glass — translates to a 71% chance of winning a 6-game set and a 79% chance of winning a best-of-3 set match — around 4 in 5 odds. Small changes to the per-game odds result in big changes to the total match odds due to the nature of the tennis scoring system.
It is also possible to directly convert a per-game odds value into an effective handicap difference, as there is an approximately linear relationship between the two. We therefore can compute a home-court-adjusted rating for each court as below:
So for the most extreme courts, the standard two-point home-court deduction is not enough to give a fair game, with Prested Glass and Hobart giving their members four handicap points of advantage. To again contextualize, the corresponding odds of Owe 15-Love indicate that, roughly, the home player is winning an extra point every game from their familiarity with the court alone. However, the mean across all courts is almost exactly two handicap points, with the median court slightly lower at 1.9 handicap points, giving further credence to the two-point rule-of-thumb.
One last piece of analysis: we can interrogate whether the home-court advantage is dependent on the standard of player involved. To do this, we aggregate players by the nearest five handicap points, and compute their games-won percentage on familiar courts against non-familiar opponents. We cannot look lower than a 5.0 handicap in this instance, because in the data for the majority of the last 24 years, these players have been marked as Category 1 and so receive a familiar court bonus on every court they play. Also, that standard tends to be majority professional players, who don’t play the majority of their matches on their home court, unlike club amateurs. For the players with handicaps less than 20, the number of available matches for the analysis is reduced as these players tend to play very few matches off the correct handicap difference.
Despite this, the level of home-court advantage is very consistent across all handicap bands, with no discernable trend in either direction. This is perhaps surprising, as better players should have a better understanding of the nuances of the game and control over where they place their shots. Thus, advanced players could be thought to be able to adjust their game more easily to new environments, compared to a beginner who can’t control the ball on their own court, let alone a foreign one. Nevertheless, it appears the advanced players can take advantage of the subtle nuances of their home court just as much as beginners can utilise the larger variations.
So next time you are on tour to a new court, don’t be disheartened by the bounce you weren’t expecting or your serve that doesn’t quite land as you would like in the knowledge of how hard your opponent will have it when they visit you. And if you are from Hobart or Prested, use your advantage to its full potential and lock in that handicap win!
Some courts are missing from the analysis, most notably Chicago, Fontainebleau and Paris.
… and f you go to Falkland, don’t worry and have fun !